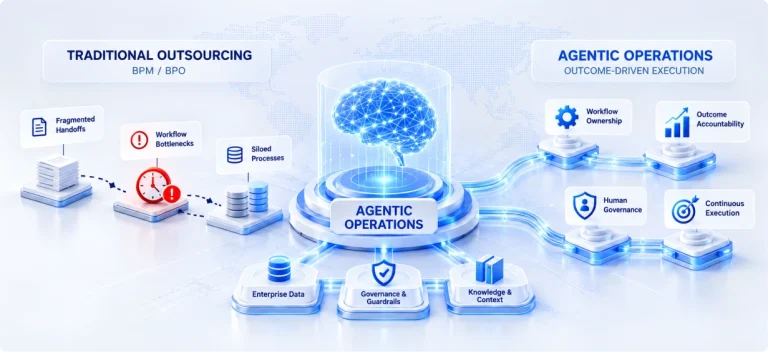

A healthy pipeline can create confidence in the revenue outlook. Yet the opportunities inside it may already be losing value. A lead waits for assignment. A proposal is delayed by an approval. A discount is used to recover time lost earlier in the process. After the deal is won, incomplete handoff information creates rework, delivery exceptions, or billing delays.
Each issue may appear manageable when viewed within an individual function. Taken together, they can weaken conversion, put pressure on margins, extend the time between demand and revenue realization, and increase the cost to serve.
That’s the visibility gap at the center of most revenue operations environments: pipeline reports show value and stage, but not how work actually moves across the systems, decisions, approvals, and teams that turn demand into realized revenue.
For revenue leaders, the question is therefore broader than how much pipeline exists. It is how much commercial value is lost as opportunities move from initial demand through sales, contracting, delivery, and billing, and where intervention will have the greatest financial impact.
Revenue performance is determined between the stages
Every stage in that lifecycle carries its own data, decisions, service levels, and ownership. And friction at any one of them compounds downstream.
Which of these shows up, and how severely, depends on the business model, operating structure, systems, and customer journey.
Revenue leakage can begin before an opportunity is qualified
Revenue risk: A high-intent inquiry sitting in a shared queue with no clear owner, or routed to the wrong team, where the rep sees contact details but not the context behind the buyer’s need.
The result: A delayed, generic response, weaker engagement, and a lower chance of progressing the opportunity. As a result, a lead stays technically “open” in the CRM long after it has actually gone cold.
A 2011 Harvard Business Review study found that businesses contacting online leads within an hour were nearly seven times as likely to qualify them as those that waited longer. The average response time in the study was 42 hours. It’s a clear signal that response ownership and routing discipline are levers worth owning, not a guarantee that speed alone converts every lead.
For revenue leaders, the diagnostic questions are: How long does a qualified inquiry wait? Who owns it during that interval? Does the first response reflect the buyer’s context? And can the organization see where routing or handoff delays occur?
Commercial delays can turn pipeline value into margin pressure
Commercial risk: A proposal stuck waiting on pricing approval, a quote rebuilt by hand because the information sits across disconnected systems, exceptions handled inconsistently from one team to the next.
The result: Proposals land later than they should, sales has less runway to defend value, and deals still close, just at a lower margin than the opportunity warranted.
Workflow gap: In quoting-intensive businesses, manual checks across scope, configuration, and pricing slow quote turnaround and trigger repeated reviews. The issue isn’t regarding sales productivity; it’s how the commercial workflow is designed.
Businesses should track approval latency, quote turnaround, pricing exceptions, discount depth, and win rates by deal type to reveal whether margin pressure stems from market conditions or internal process delays.
Winning the deal does not guarantee revenue realization
The pipeline often receives its strongest executive attention before a deal closes. Yet the work required to deliver can expose another set of revenue risks.
If the sales-to-delivery handoff omits scope decisions, customer commitments, pricing assumptions, or implementation dependencies, the receiving team must reconstruct the deal. That can create repeated customer questions, avoidable rework, delayed onboarding, or disputes about what was included.
A delivery milestone may then be completed later than planned. If billing depends on that milestone or on information transferred from operations, invoicing can also be delayed. The contract may be recorded as won, while the business waits longer to recognize, invoice, or collect the value it expected.
Incomplete handoffs cascade: rework delays delivery, and delivery delays hit billing and cash realization. The exact size of that effect varies by contract terms and revenue-recognition policy, which is exactly why it needs measuring, not assuming.
Revenue visibility: Closed-won status alone doesn’t confirm revenue realization. Delivery progress, milestone completion, resolved exceptions, and billing readiness all matter.
Rework and exceptions increase the cost of serving revenue
Revenue growth can conceal rising operational effort. When teams repeatedly validate records, chase approvals, resolve exceptions, or re-key information between systems, they consume capacity without adding customer value. This effort is spread across sales operations, finance, delivery, and support, so no single function sees the total drag on margin.
Connecting these signals to financial outcomes, such as rework frequency, exception volume, approval wait time, and cost-to-serve by customer, product, or service line reveals where operational effort is eroding margins. This is what separates growth that scales efficiently from growth that quietly adds cost.
Why traditional revenue reporting misses the friction
Most organizations already track leads, opportunities, bookings, milestones, invoices, and collections, but those views sit in separate functions and systems. They describe outcomes at each stage without explaining the work and decisions that connect them.
CRM, ERP, finance, and delivery platforms aren’t the problem. They remain the systems of record. What’s missing is a connected view across them: where work stalls, where information drops, and which conditions are actually hurting commercial performance.
What leaders should measure across the revenue lifecycle
A useful RevOps diagnosis connects commercial outcomes to the operational measures that drive them. Rather than adding another dashboard of disconnected metrics, it pinpoints where execution gaps affect revenue, margin, cycle time, and cost.
-
→
Demand and qualification: Speed to lead, routing accuracy, qualification rate, and lead-to-opportunity conversion.
-
→
Sales and commercial execution: Follow-up completion, quote turnaround, approval latency, pricing exceptions, discount depth, and win rate.
-
→
Contracting and handoffs: Handoff acceptance time, scope completeness, clarification loops, and ownership of open actions.
-
→
Delivery and billing: Milestone cycle time, rework frequency, exception aging, billing readiness, and invoice delay.
-
→
Revenue and cost performance: Revenue realization, gross margin variance, cost-to-serve, and operational effort per customer or transaction.
Measurement focus: Measurement priorities vary by business model. Services enterprises typically focus more on utilization, delivery rework, and billing readiness. Product and distribution businesses place greater emphasis on pricing integrity, quote accuracy, order handoffs, and fulfillment. In both cases, the objective is to connect operational performance to financial impact.
Five questions that expose revenue execution friction
Revenue leaders can begin by tracing one representative customer journey across the organization to understand how the revenue system performs as a whole, rather than audit individual employees.
Response ownership: Where does customer intent wait for an owner, decision, or meaningful response?
Approval bottlenecks: Which pricing, quoting, or contract approvals create the greatest delays or inconsistencies?
Handoff gaps: What information is repeatedly reconstructed or clarified as work moves from sales to delivery and finance?
Operational rework: Where do rework, exceptions, or manual coordination increase the cost of serving a customer?
Financial impact: Which operational delays are most closely linked to lost conversion, lower margins, delayed billing, or higher cost-to-serve?
The underlying gap: These questions rarely trace back to one broken step. They trace back to a revenue system that no one owns end to end. That’s the specific gap a structured RevOps diagnosis closes.
From revenue friction to controlled execution
Improving revenue performance starts with understanding where work stalls, decisions are delayed, information gets lost, and operational friction affects the P&L.
Flatworld.ai’s RevOps diagnosis approaches this as a 4–6 week executive diagnostic, structured in three steps:
Map the revenue
system
Trace workflows from lead capture through sales, contracting, delivery, and billing. Identify bottlenecks, handoff gaps, approval delays, and recurring exceptions.
Prioritize by business
impact
Connect these gaps to lost conversion, margin pressure, cycle time, and cost-to-serve. Sequence workflow improvements based on financial impact, starting with quick wins before broader changes.
Redesign and govern
execution
Simplify workflows, connect existing systems, and introduce automation where it adds value. Apply defined business rules, validation, exception handling, and human oversight to maintain accountability.
From diagnosis to action: Automation follows workflow design, not the other way around. The goal is measurable, controlled execution change, not more disconnected automation.